Plot (ggplot) the distribution of player classements
Source:R/graph.pct.classements.R
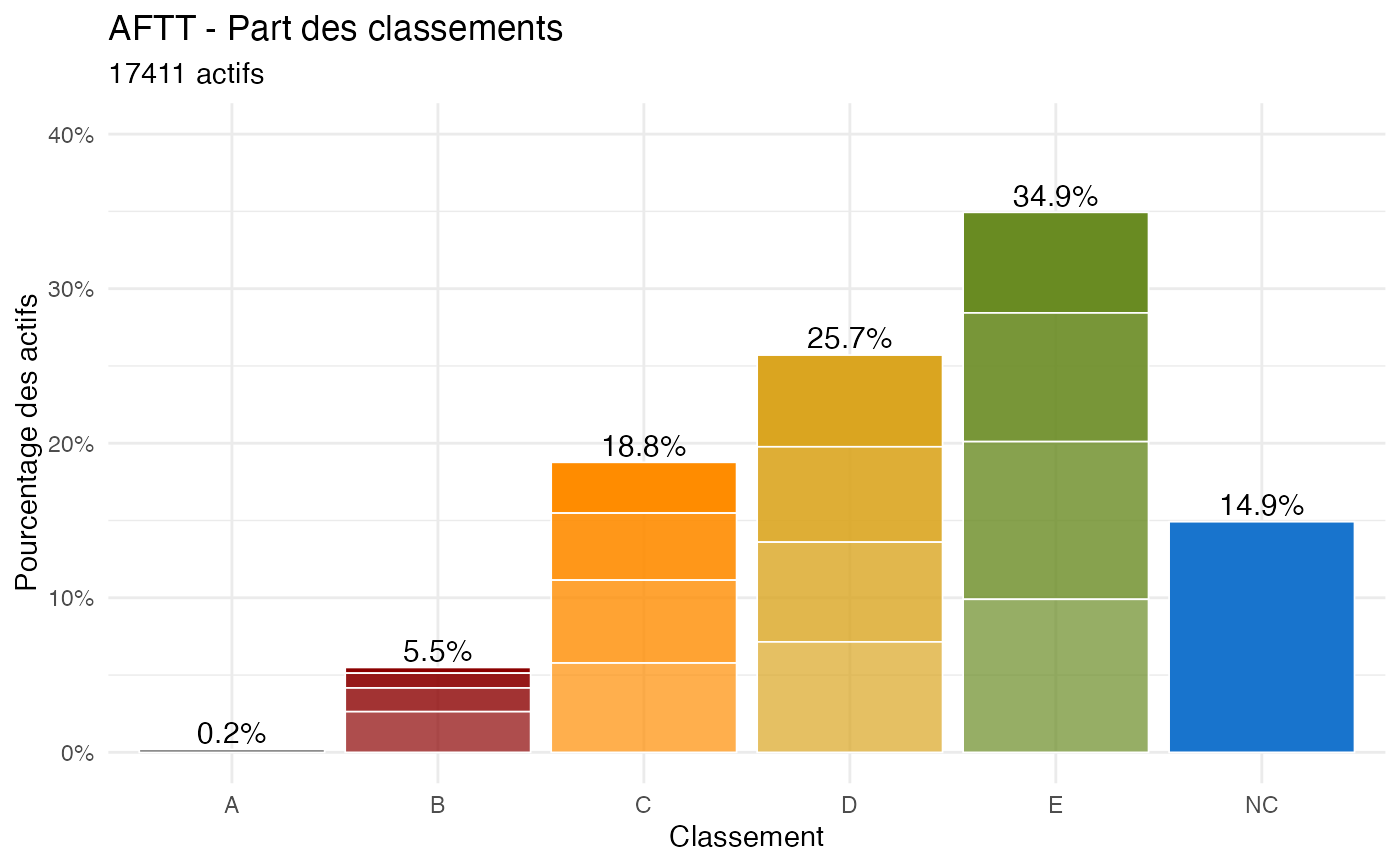
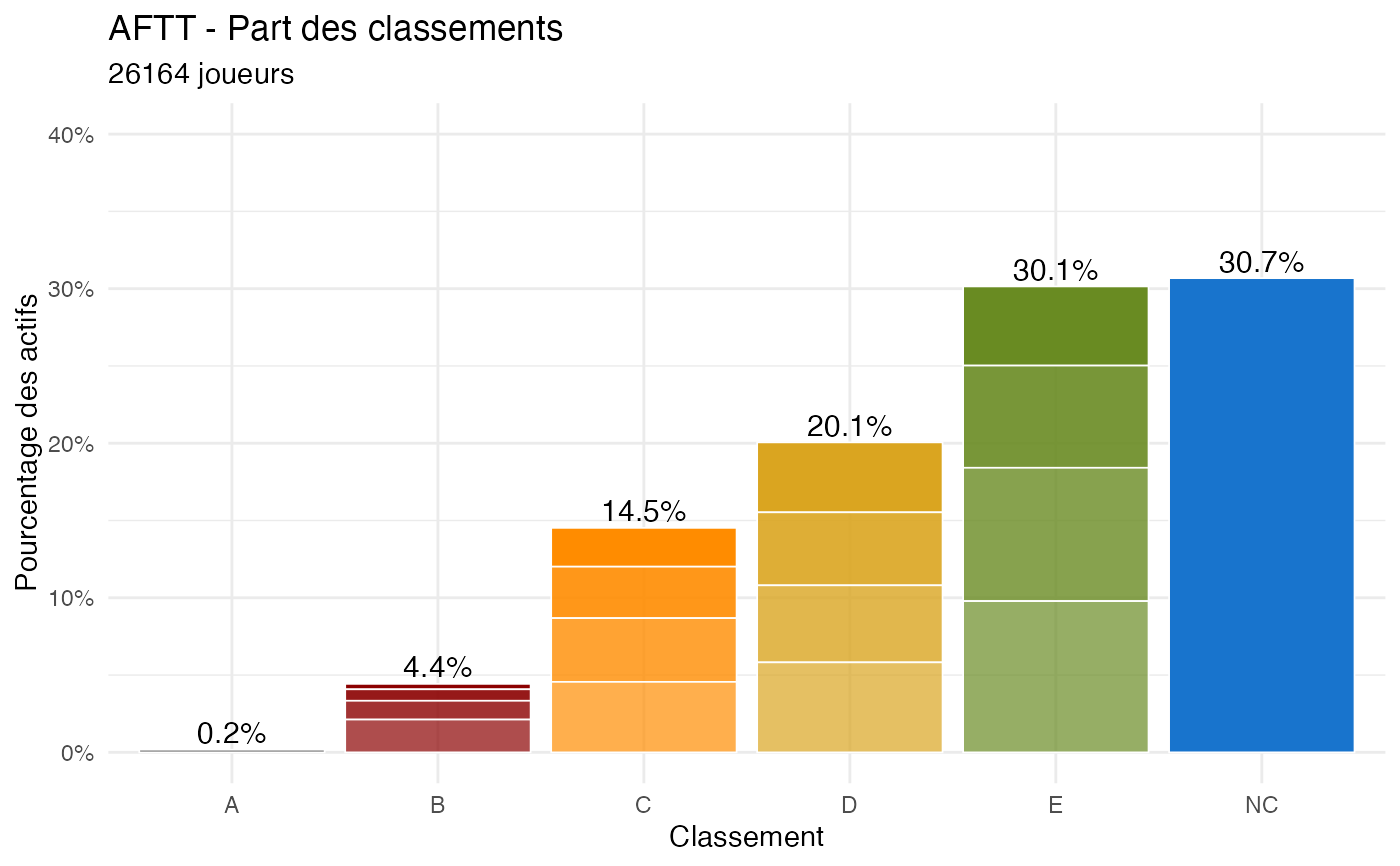
graph.pct.classements.RdProduces a bar chart showing the percentage of players in each classement by lettre 'A,B,C,D,E), with transparency varying by the classement chiffre (excpet for A and NC).
Usage
graph.pct.classements(
  data,
  col_lettre = "classement_lettre",
  col_chiffre = "classement_chiffre",
  col_rk_inactive = "position_bis",
  actifs_only = TRUE,
  label_statut = if (actifs_only == TRUE) "actifs" else "joueurs",
  title = "AFTT - Part des classements",
  x_label = "Classement",
  y_label = "Pourcentage des actifs",
  ylim_max = 0.4,
  fill_values = c(A = "grey30", B = "darkred", C = "darkorange", D = "goldenrod", E =
    "olivedrab4", NC = "dodgerblue3"),
  alpha_values = c(1, 0.9, 0.8, 0.7, 1)
)
Arguments
- data
A data frame containing player data.
- col_lettre
Character. Name of the column containing the classement letter (e.g. A, B, C, D, E, NC). Default:
"classement_lettre".- col_chiffre
Character. Name of the column containing the numeric part of the classement. Default:
"classement_chiffre".- col_rk_inactive
Character. Name of the column used to identify inactive players. Only used when
actifs_only = TRUE. Default:"position_bis".- actifs_only
Logical. If
TRUE(default), filters out rows wherecol_rk_inactive == "Inactive"before plotting.- label_statut
Character. Word displayed in the subtitle after the player count. Defaults to
"actifs"whenactifs_only = TRUEand"joueurs"otherwise. Can be overridden with any character string.- title
Character. Plot title. Default:
"AFTT - Part des classements".- x_label
Character. X-axis label. Default:
"Classement".- y_label
Character. Y-axis label. Default:
"Pourcentage des actifs".- ylim_max
Numeric. Upper limit of the y-axis (as a proportion, not a percentage). Default:
0.4.- fill_values
Named character vector. Colours for each letter rank. Names must match the levels present in
col_lettre. Default covers A, B, C, D, E, NC.- alpha_values
Numeric vector. Alpha values mapped to
col_chiffrelevels, controlling bar transparency. Default:c(1, 0.9, 0.8, 0.7, 1)(no transparency for A and NC's, B6/C6/D6/E6 more transparent than B0/C0/D0/E0)